Socially isolated wards and gated communities in the Gauteng City-Region
-
Dr Caryn Abrahams,
Kerry Bobbins
- Date of publication: 01 January 2015
- Download map

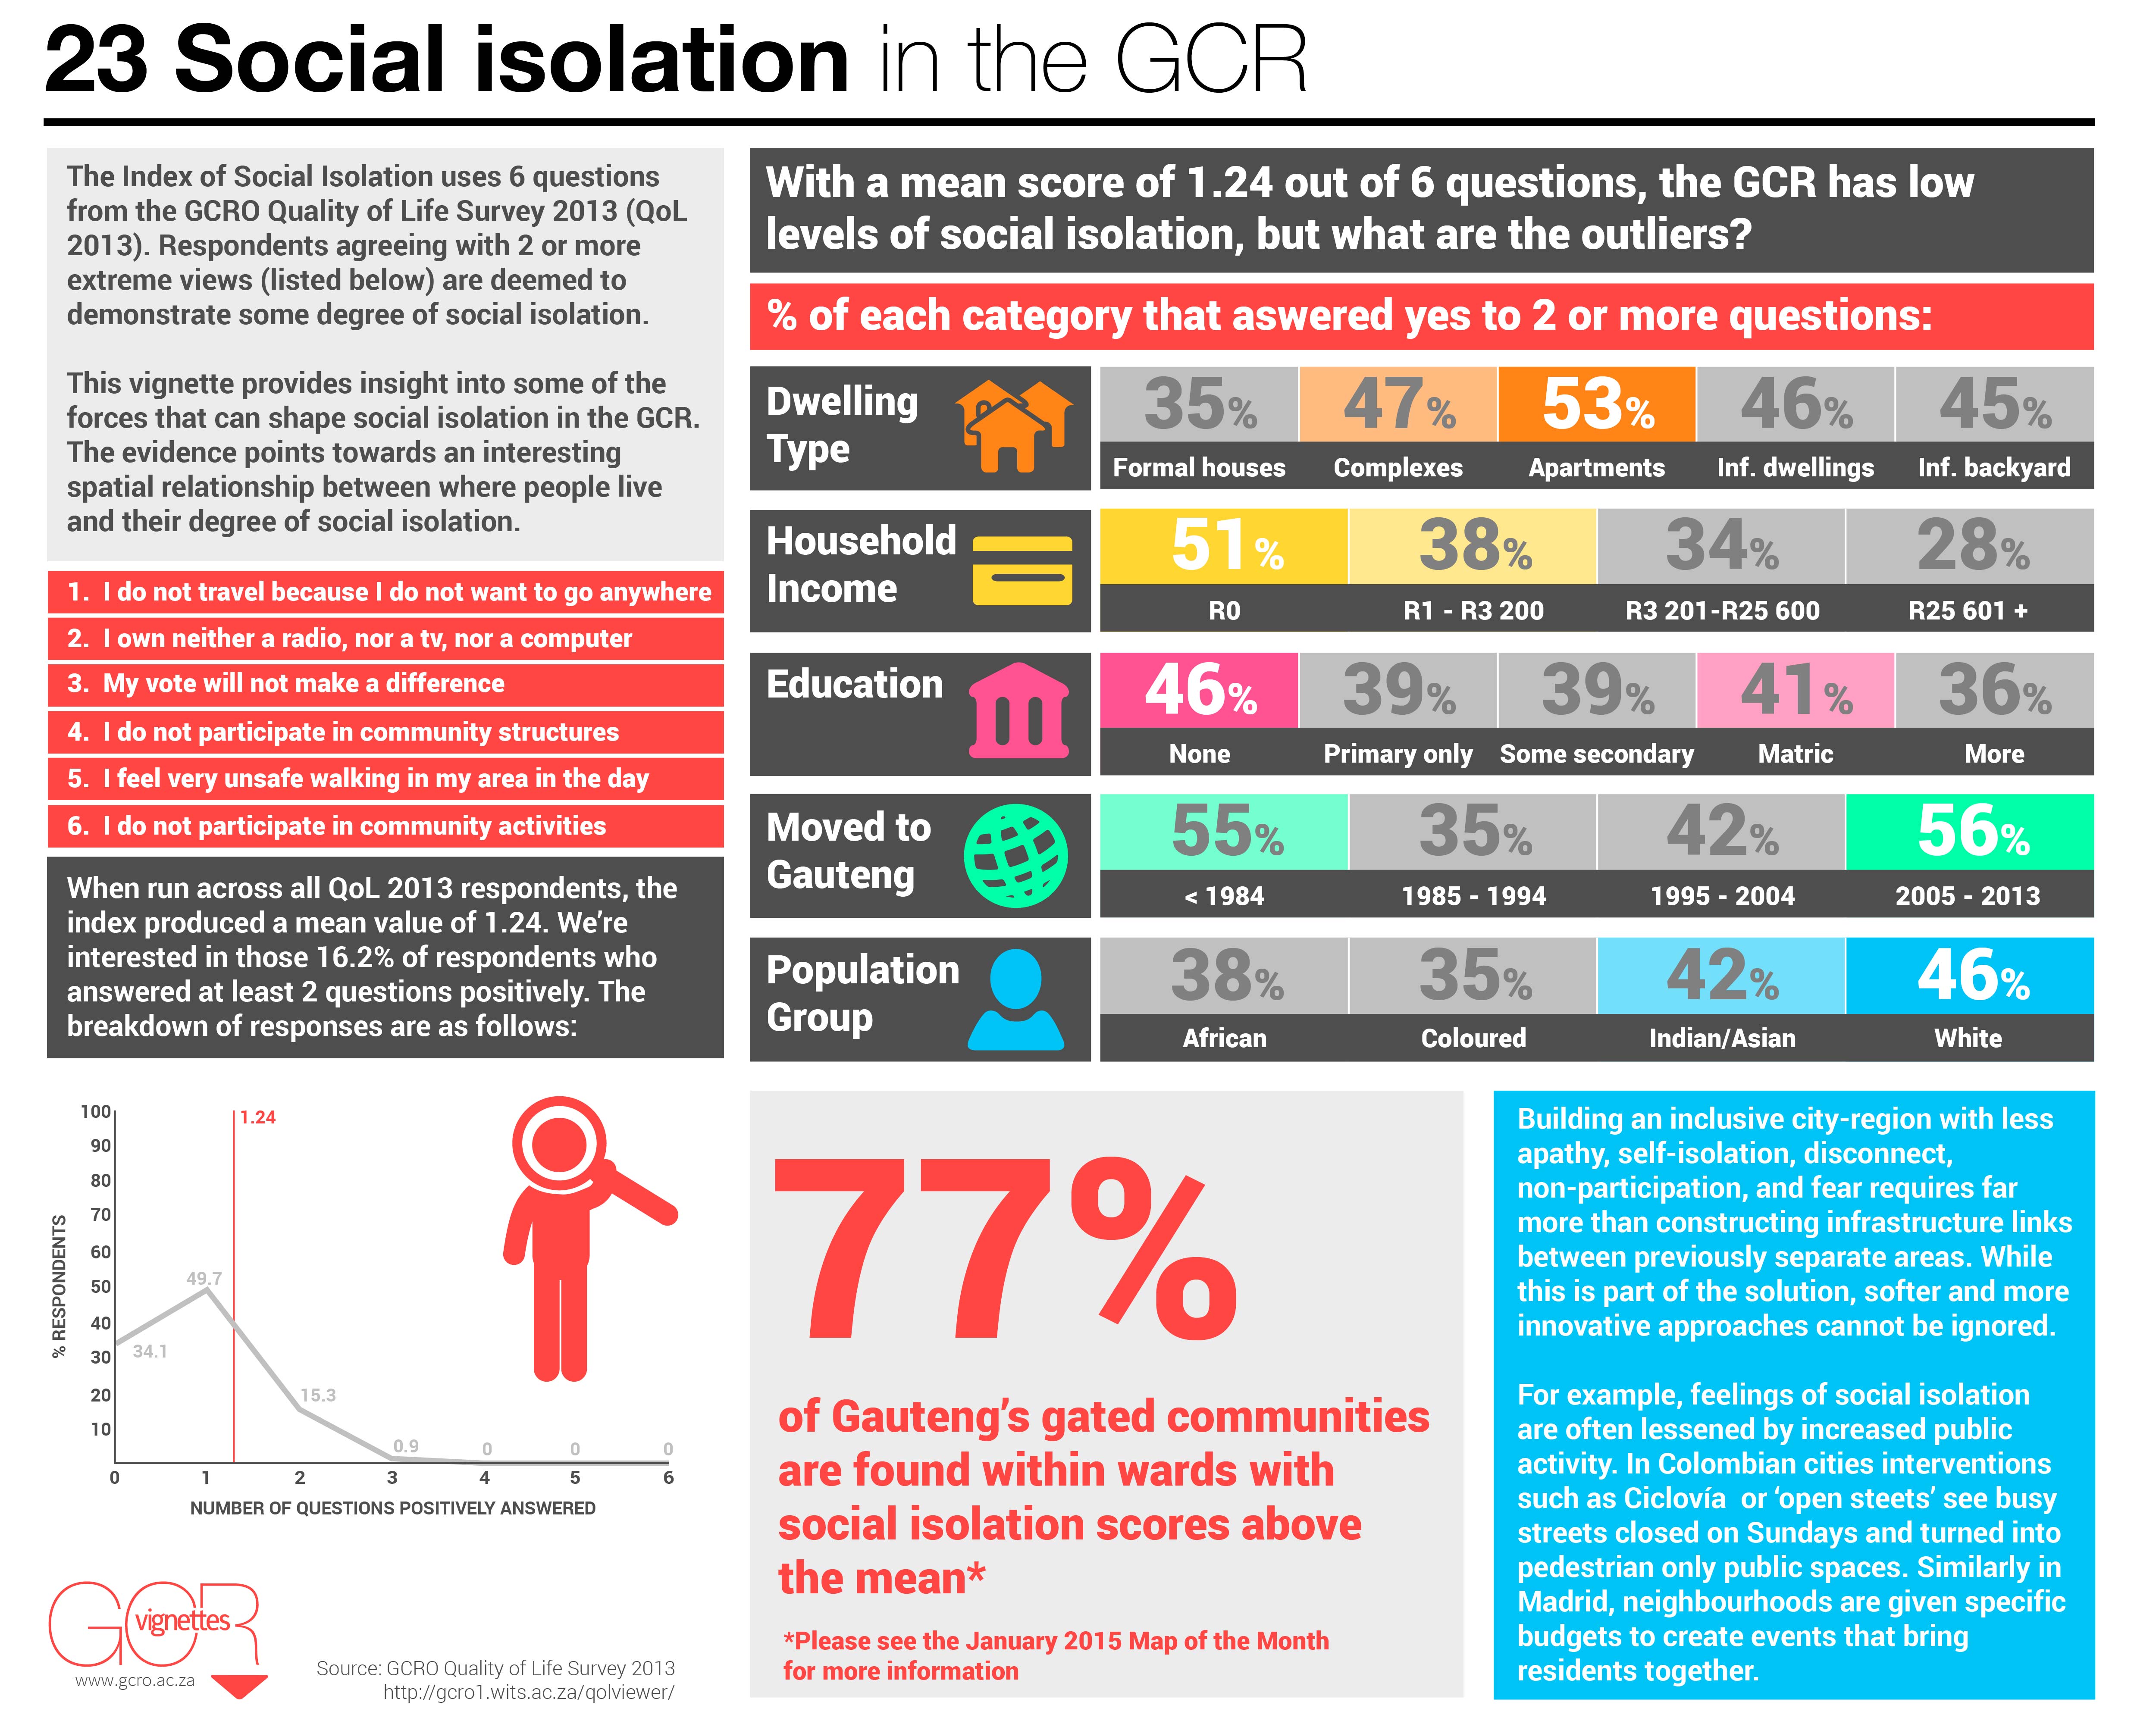
The January map of the month depicts socially isolated wards and gated communities in the Gauteng City-Region (GCR). For more information about this study, please see the GCRO’s January 2015 vignette on Social Isolation in the GCR. The map was created using GCRO’s 2013 Quality of Life (QoL) survey data to inform this particular Index of Social Isolation. The index was developed by selecting six survey questions that relate to a respondent's self, external or inflicted detachment from society. The questions were selected based on their ability to provide an understanding of social isolation and included responses that measure self-isolation, disconnection from current affairs and news, feeling of apathy, no community participation, and fear of their neighbourhood.
The index was built using the extreme outliers of the survey respondents. For example, only those respondents indicating that they do not want to go anywhere in response to the question ‘What is the main reason you have not made any trips or travelled in the last month?’ were considered and included in the results. This particular index therefore presents only on extreme views held by respondents. The list of six survey questions and selected responses are listed in the table below. All responses are valued equally in the index.
Question |
Response |
Measure |
|
|
1 |
|
I don't want to go anywhere |
Self-isolation |
|
2 |
Does this household have any of the following that are in good working order, that is not broken? |
Household does not have access to a radio, cd player or music system, or any other technological asset |
Disconnection from current affairs and news |
|
3 |
Why do you not plan to vote? |
Does not think his/her vote will make any difference |
Indifference and/or apathy |
|
4 |
In the last year, have you or any member of your household attended any of the following? |
None |
Non-participation in local political and community structures |
|
5 |
How safe do you feel walking in the area where you live during the day? |
Very unsafe |
Fear |
|
6 |
In the past year, have you participated in the activities of any of the following clubs? |
No |
Non-participation in community organised activities |
The Social Isolation index mean scores were mapped per ward (out of a total score of 6) and were overlaid by a gated communities layer (boomed off areas, estates and sectional schemes). Mean social isolation scores fall within a range of 0.42 - 2.04, indicating that wards within the GCR have relatively low levels of social isolation. Compared with the Gauteng mean of 1.24, the social isolation index scores demonstrate that some wards do have higher levels of social isolation (1.25 - 2.04).
Interestingly, wards that indicate some degree of social isolation partially align with traditional segregation patterns of apartheid planning, where marginalised and underserviced areas show low social development scores. Wards that showed higher degrees of social isolation (mean scores above 1.24 out of 6) include suburbs, with no gated communities, such as Diepsloot, Theresa Park, Salvokop, KwaThema and Munsieville. However, wealthier suburbs, with many gated communities, such as Morningside, Sandton, Randburg and Northcliff also showed higher degrees of social isolation.
To investigate this further, the social isolation index categories that fall above the Gauteng mean (1.25 - 2.04) were used to determine the percentage of gated communities that fall within wards with a higher degree of social isolation. It was calculated that 77% of all gated communities fall within these wards, indicating that there is a relationship between respondents living in gated communities and elevated levels of social isolation.
